Yahoo! Finance is a prominent website featuring financial news, press releases, financial reports and quantitive data on various assets. We are going to go through some examples on how data could be scraped from this portal. We are going to scrape two kinds of data: fundamental infomation on how well various public companies are performing financially and stock price time series.
But first we need to have a list of stock tickers (symbols) for companies we want to gather information on. We could write a simple text file with one ticker per line, but it’s not difficult to apply a little technical trick here. If we go to Most Actives page, we get a table listing some well performing stocks. For the purpose of further development, we want the first 25 of them. A little poking around reveals that there’s a private API servicing the table and heat map here (load the page, press the “Heatmap View” element, see what appears in DevTools Network tab with XHR filter being enabled).
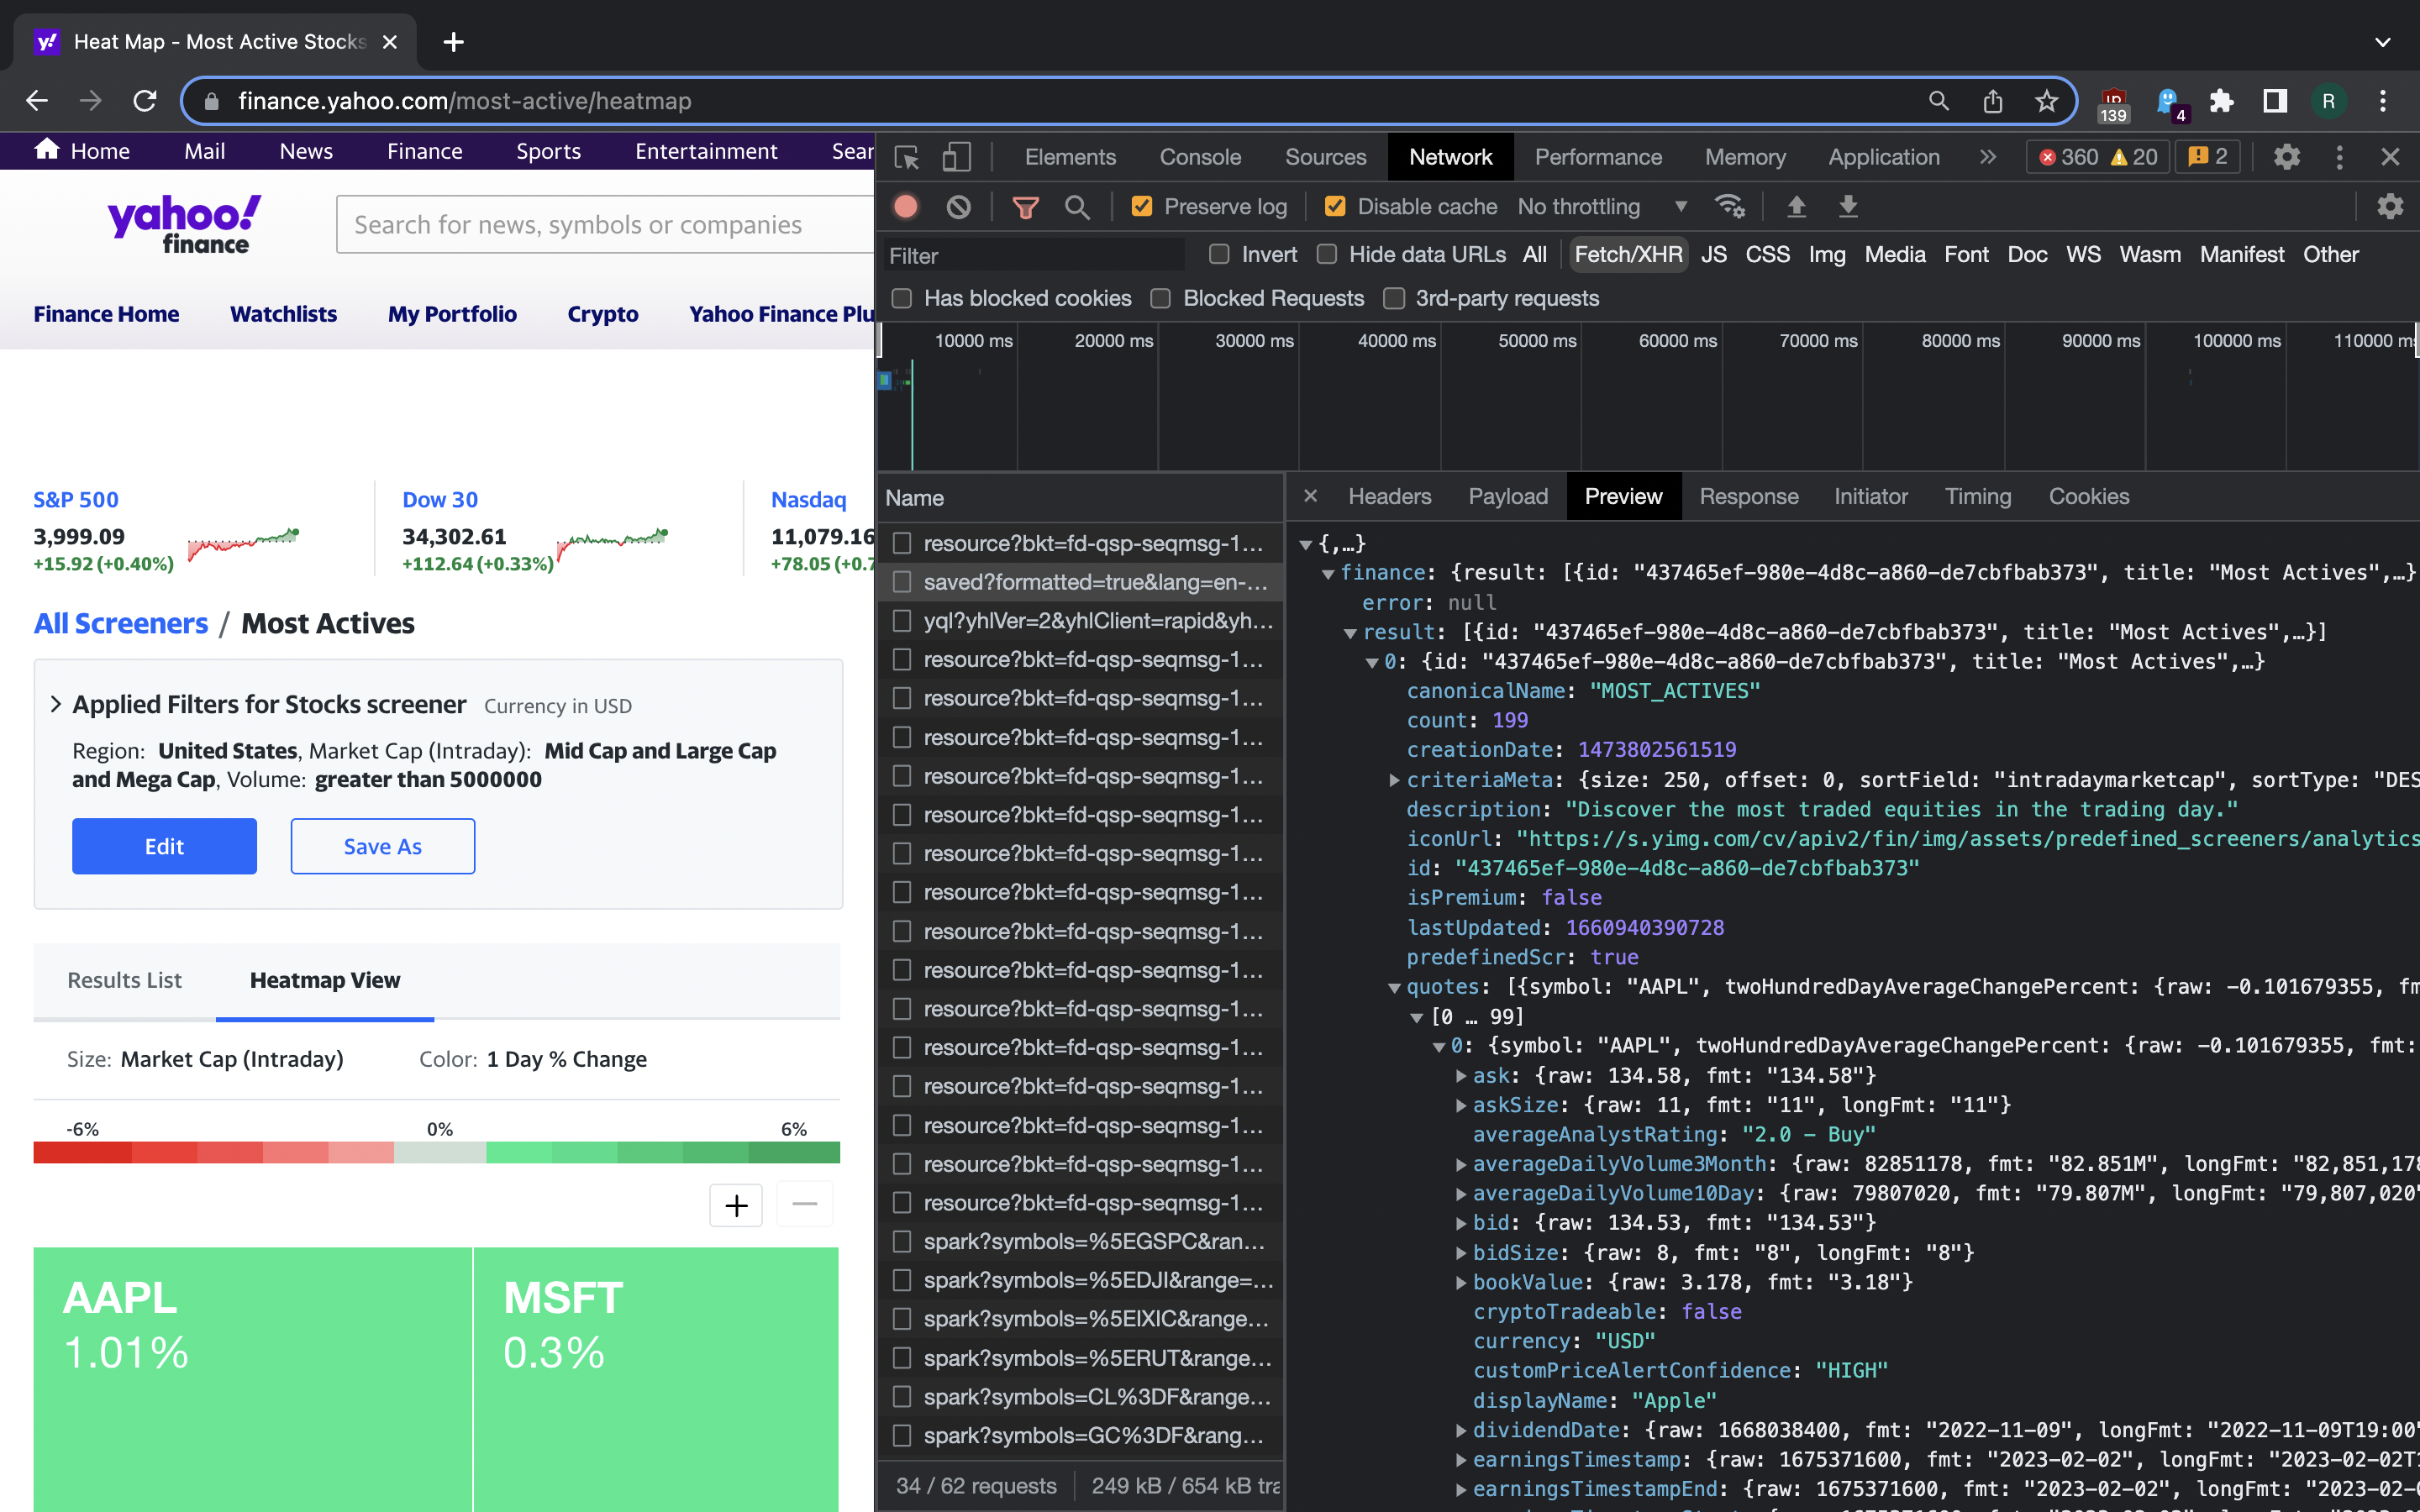
Data on the first 25 entries in the list can be retrieved with just a HTTPS GET request:
$ curl "https://query1.finance.yahoo.com/v1/finance/screener/predefined/saved?formatted=true&lang=en-US®ion=US&scrIds=most_actives&start=0&count=250&enableSectorIndustryLabelFix=true&sortField=intradaymarketcap&sortType=DESC&corsDomain=finance.yahoo.com"
It’s just like that. No need to worry about headers or cookies or proxies.
Now we can use jq to parse the JSON we are receiving from this API:
$ curl -s "https://query1.finance.yahoo.com/v1/finance/screener/predefined/saved?formatted=true&lang=en-US®ion=US&scrIds=most_actives&start=0&count=25&enableSectorIndustryLabelFix=true&corsDomain=finance.yahoo.com" |\
jq -r ".finance.result[0].quotes[].symbol" > tickers.txt
$ wc -l tickers.txt
25 tickers.txt
Just a single shell command got us the 25 tickers to play with.
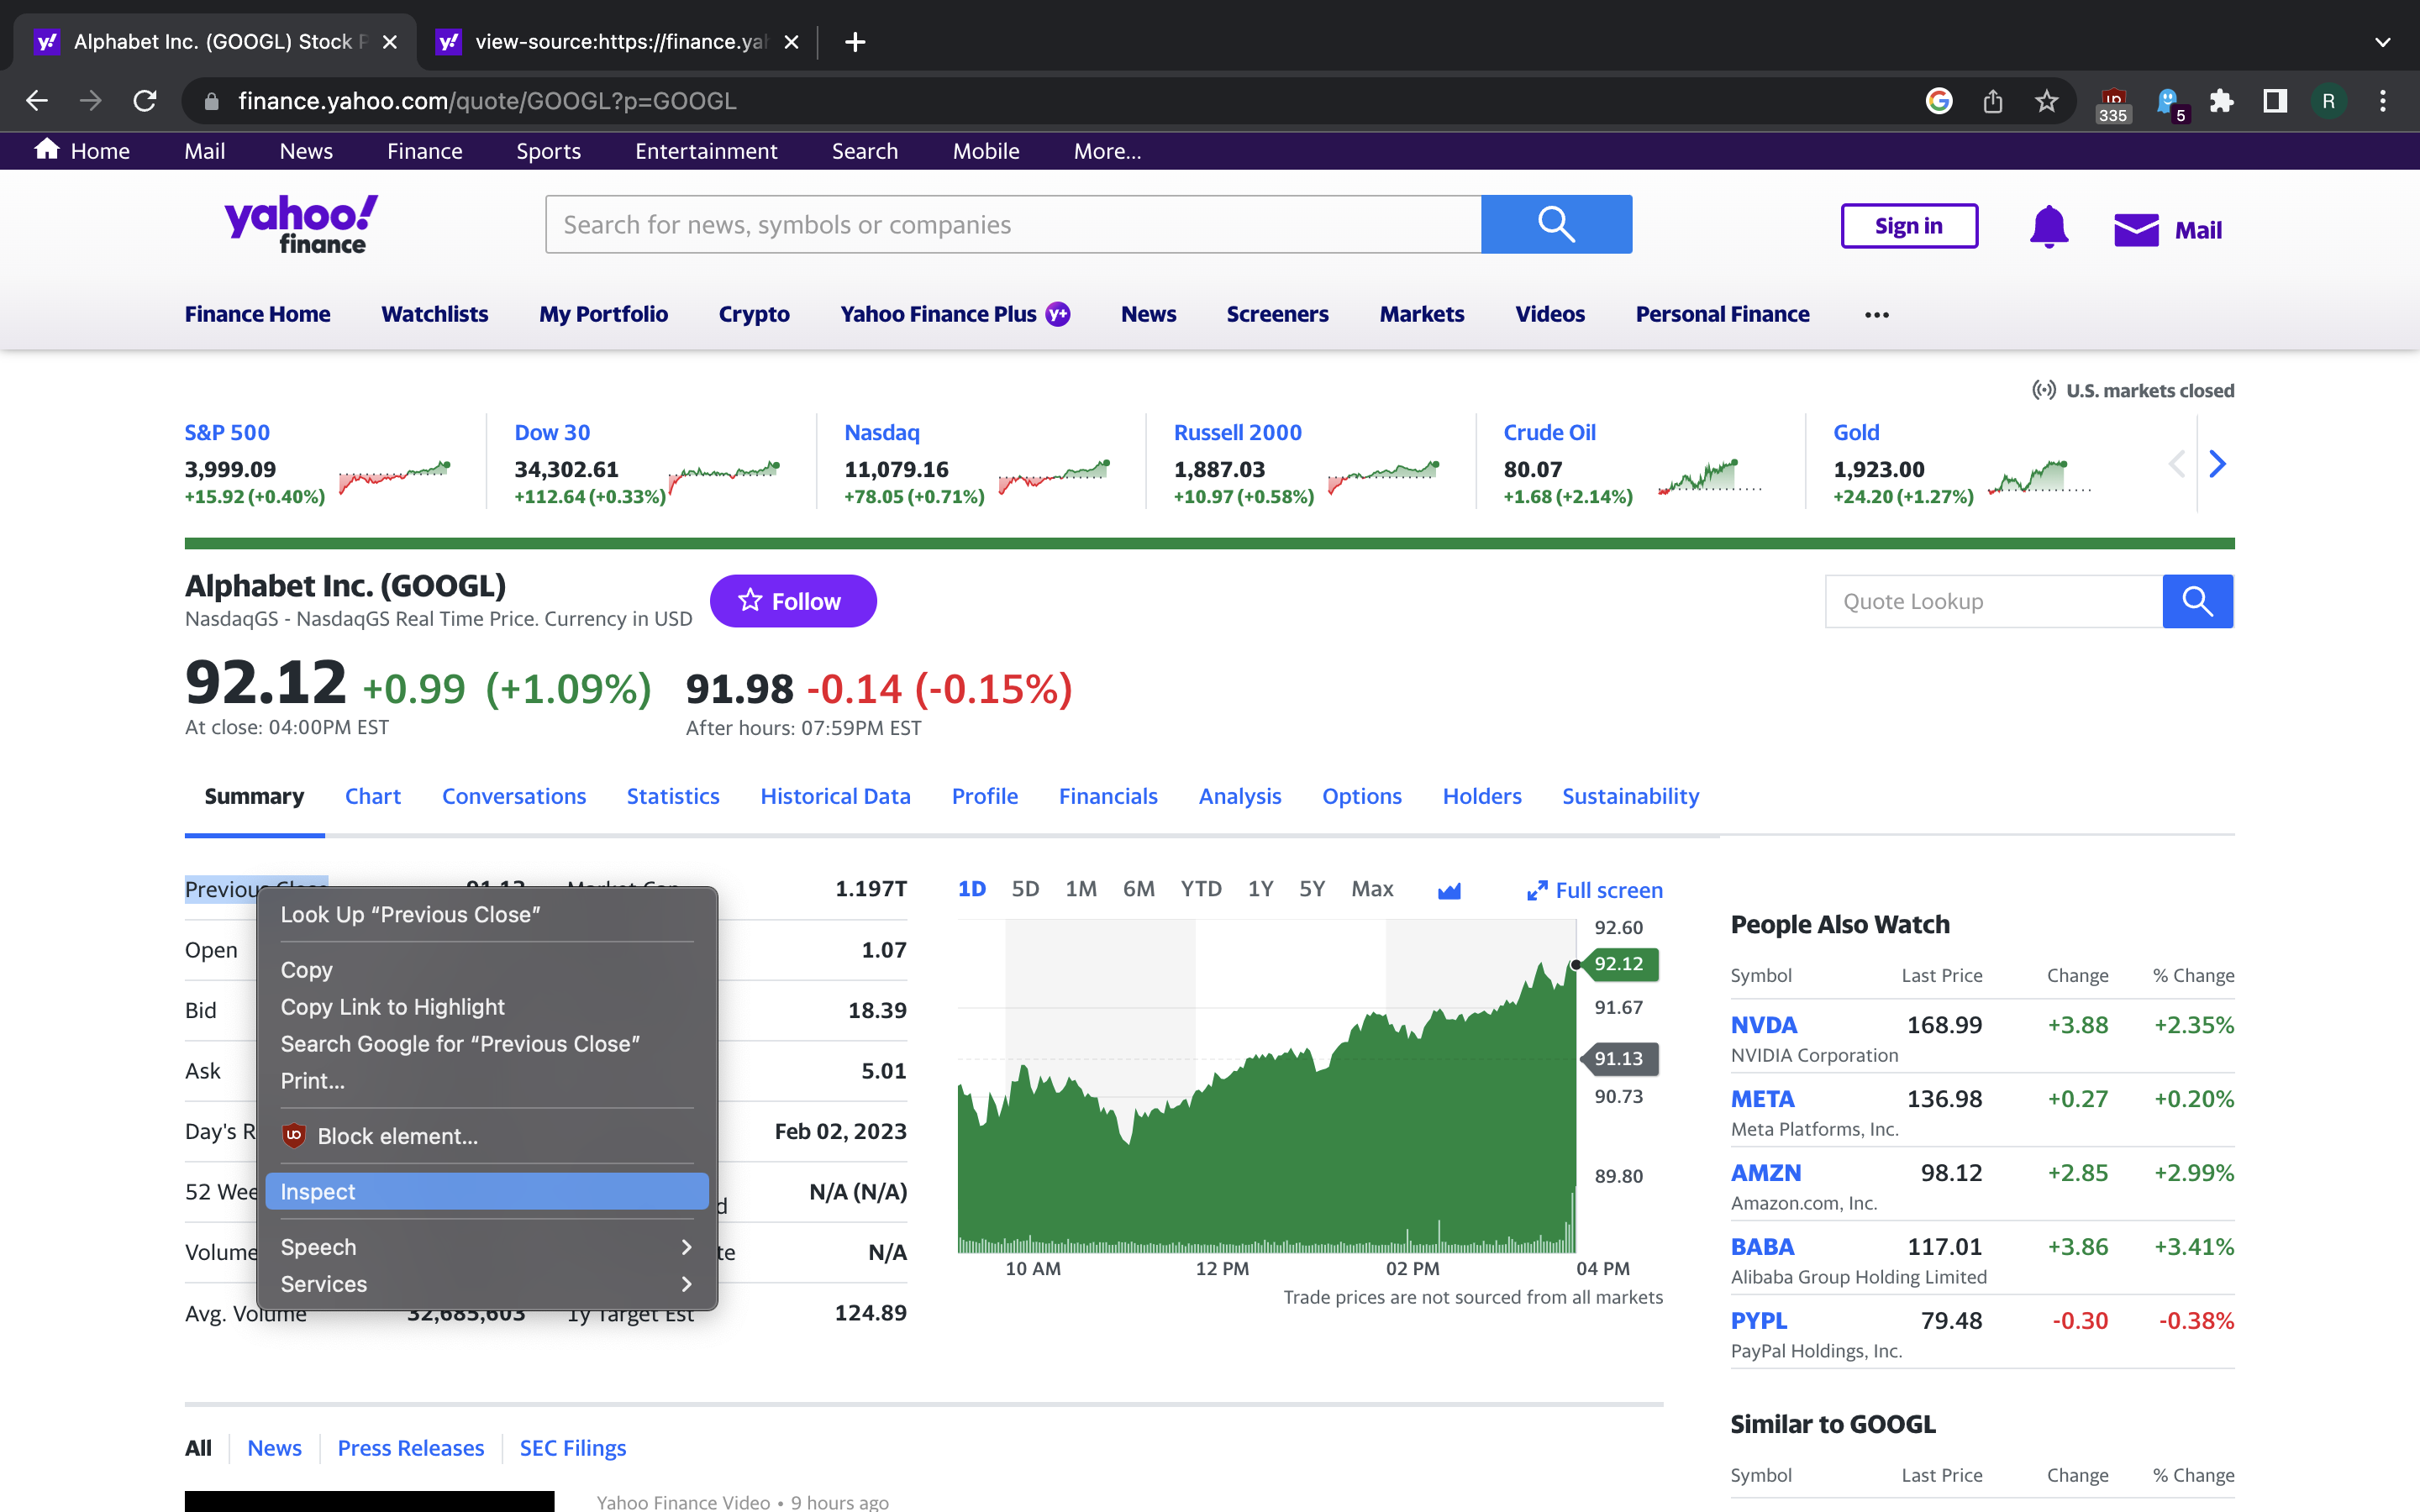
Now let us explore the page on Yahoo! Finance for each stock, so that we could scrape the summary of fundamentals: trade volume, market cap, etc. One example is Alphabet Inc. page. Here we have a table with various numbers we want to scrape in the summary tab and a simple chart with price over time. We will scrape the former soon and get to the latter later.
How does the DOM structure look like in the summary table? Let’s select one of
the labels in the table, right-click on it and choose Inspect. We get the
Chrome DevTools panel with this element being highlighted in the Elements tab.
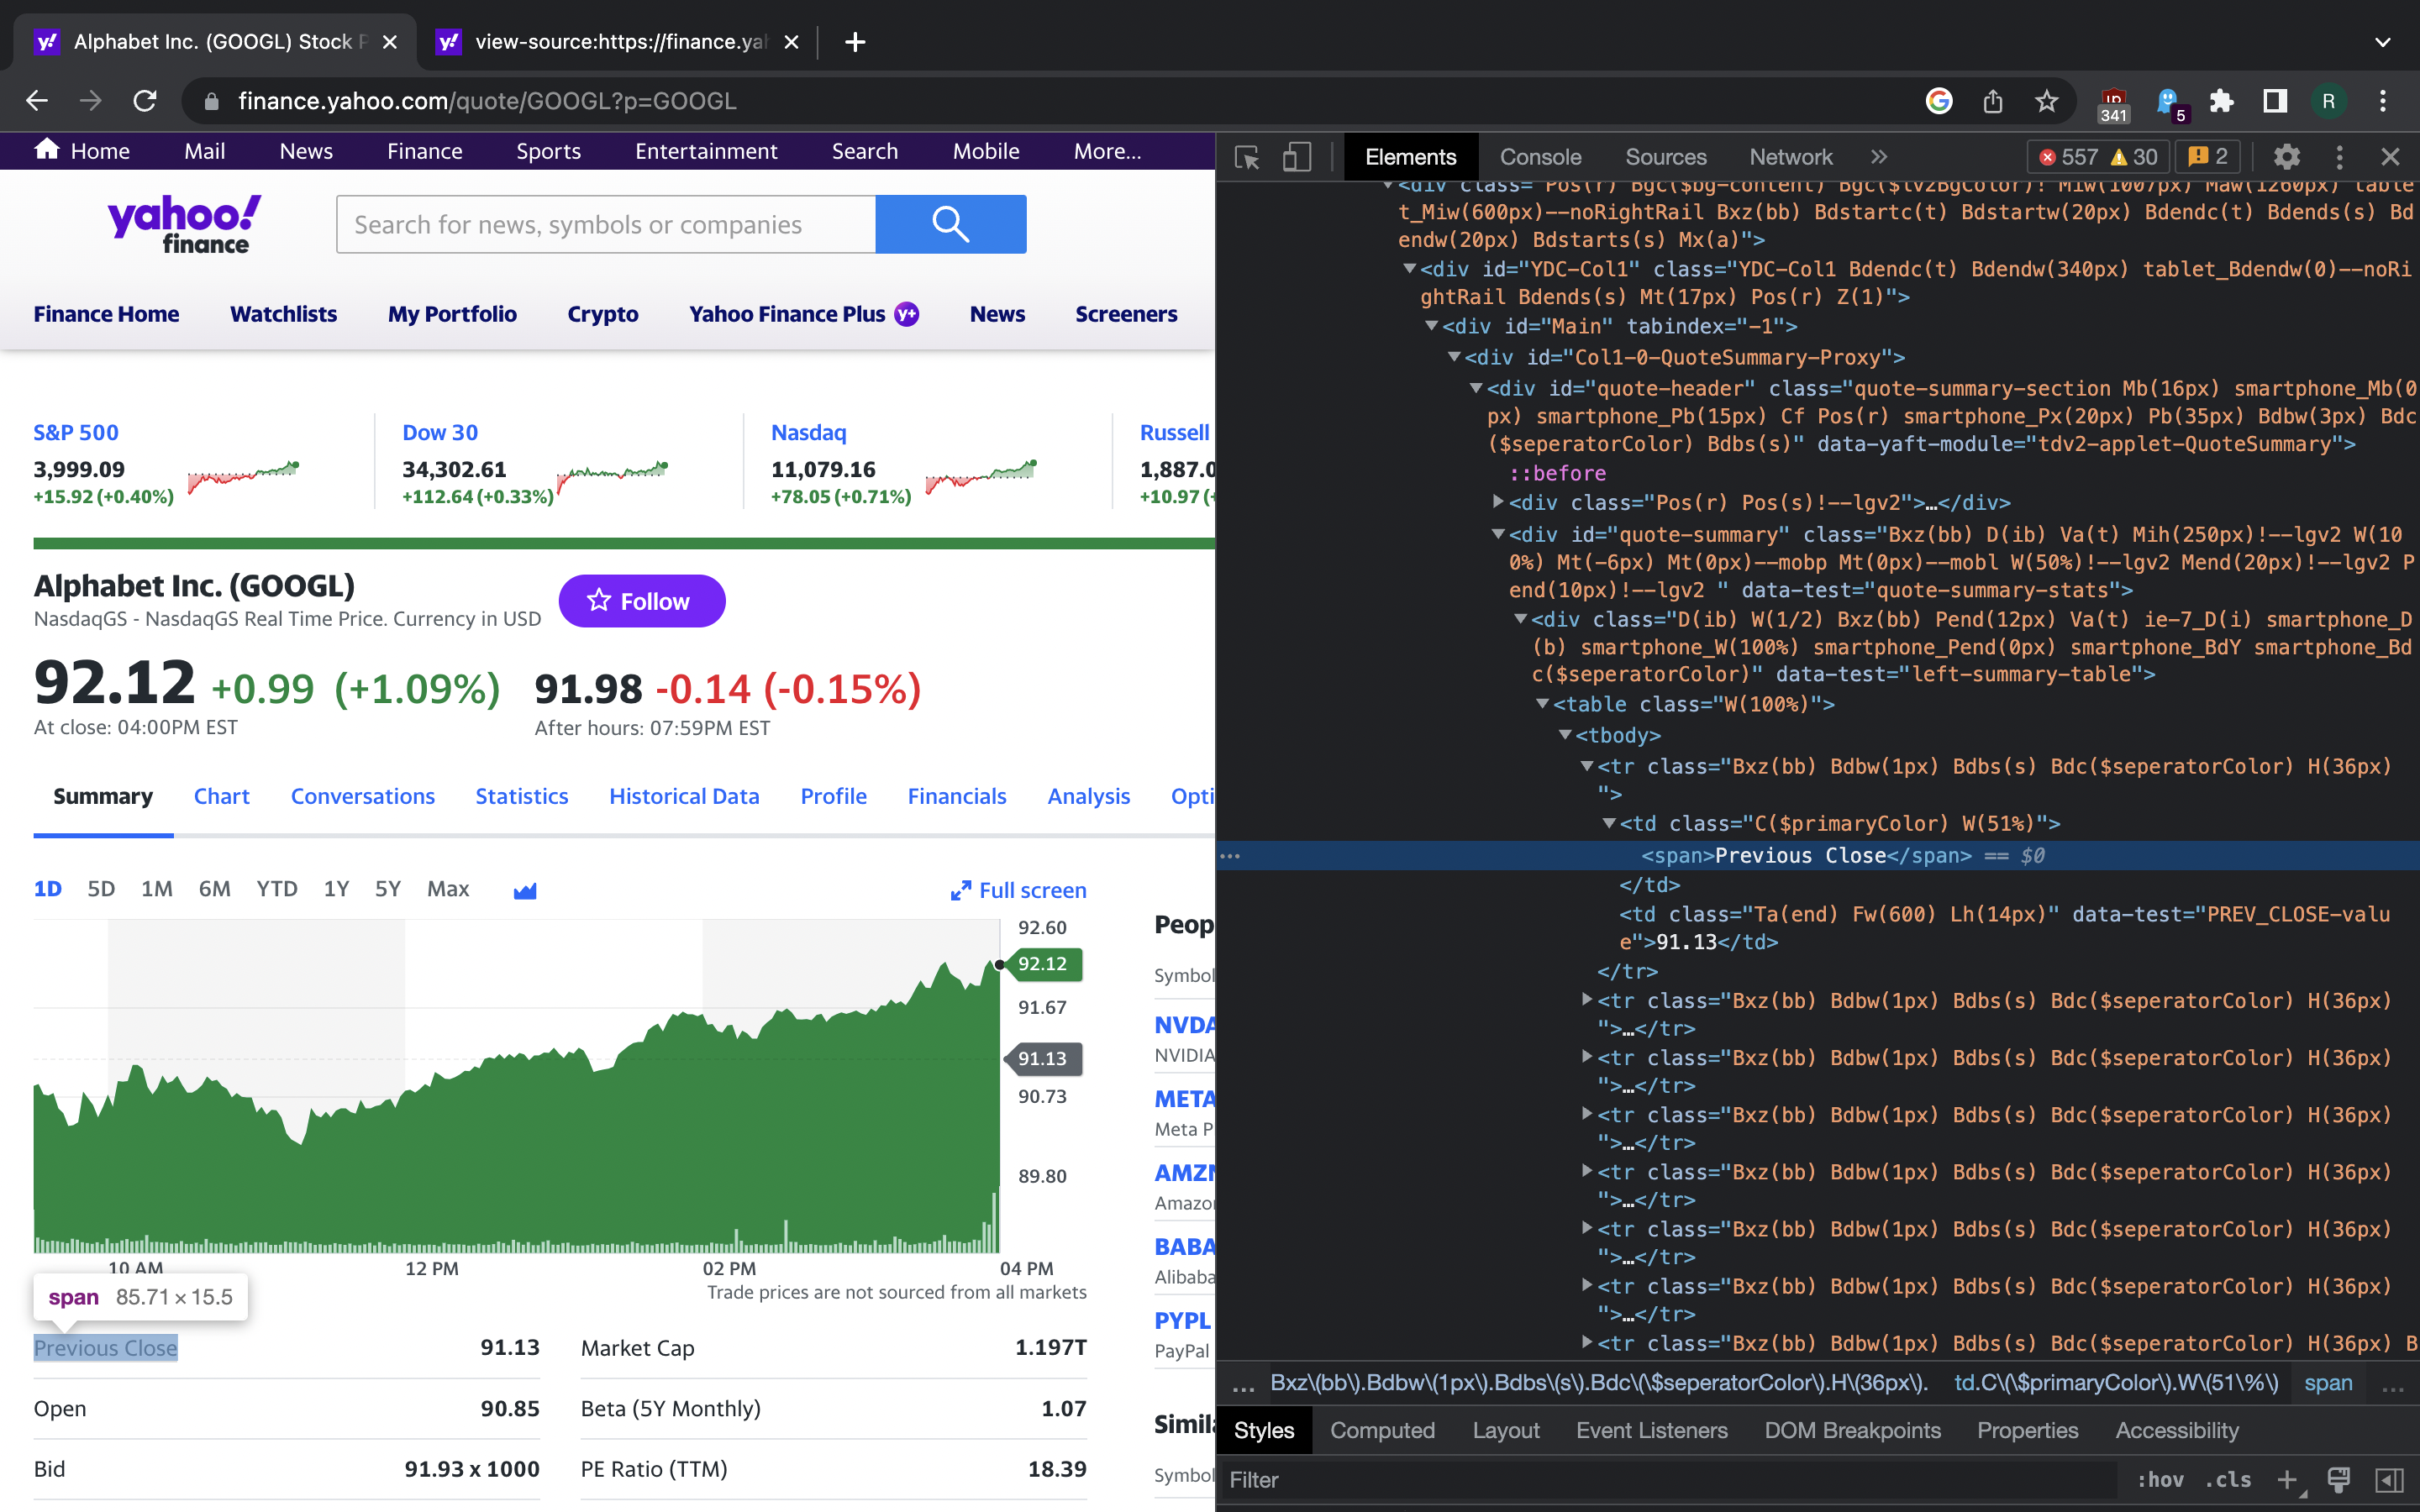
Now we are looking for some trait that uniquely identifies each part of the
page that we want to scrape. <td> element next to the one we selected
has data-test attribute with value PREV_CLOSE-value. This looks promising.
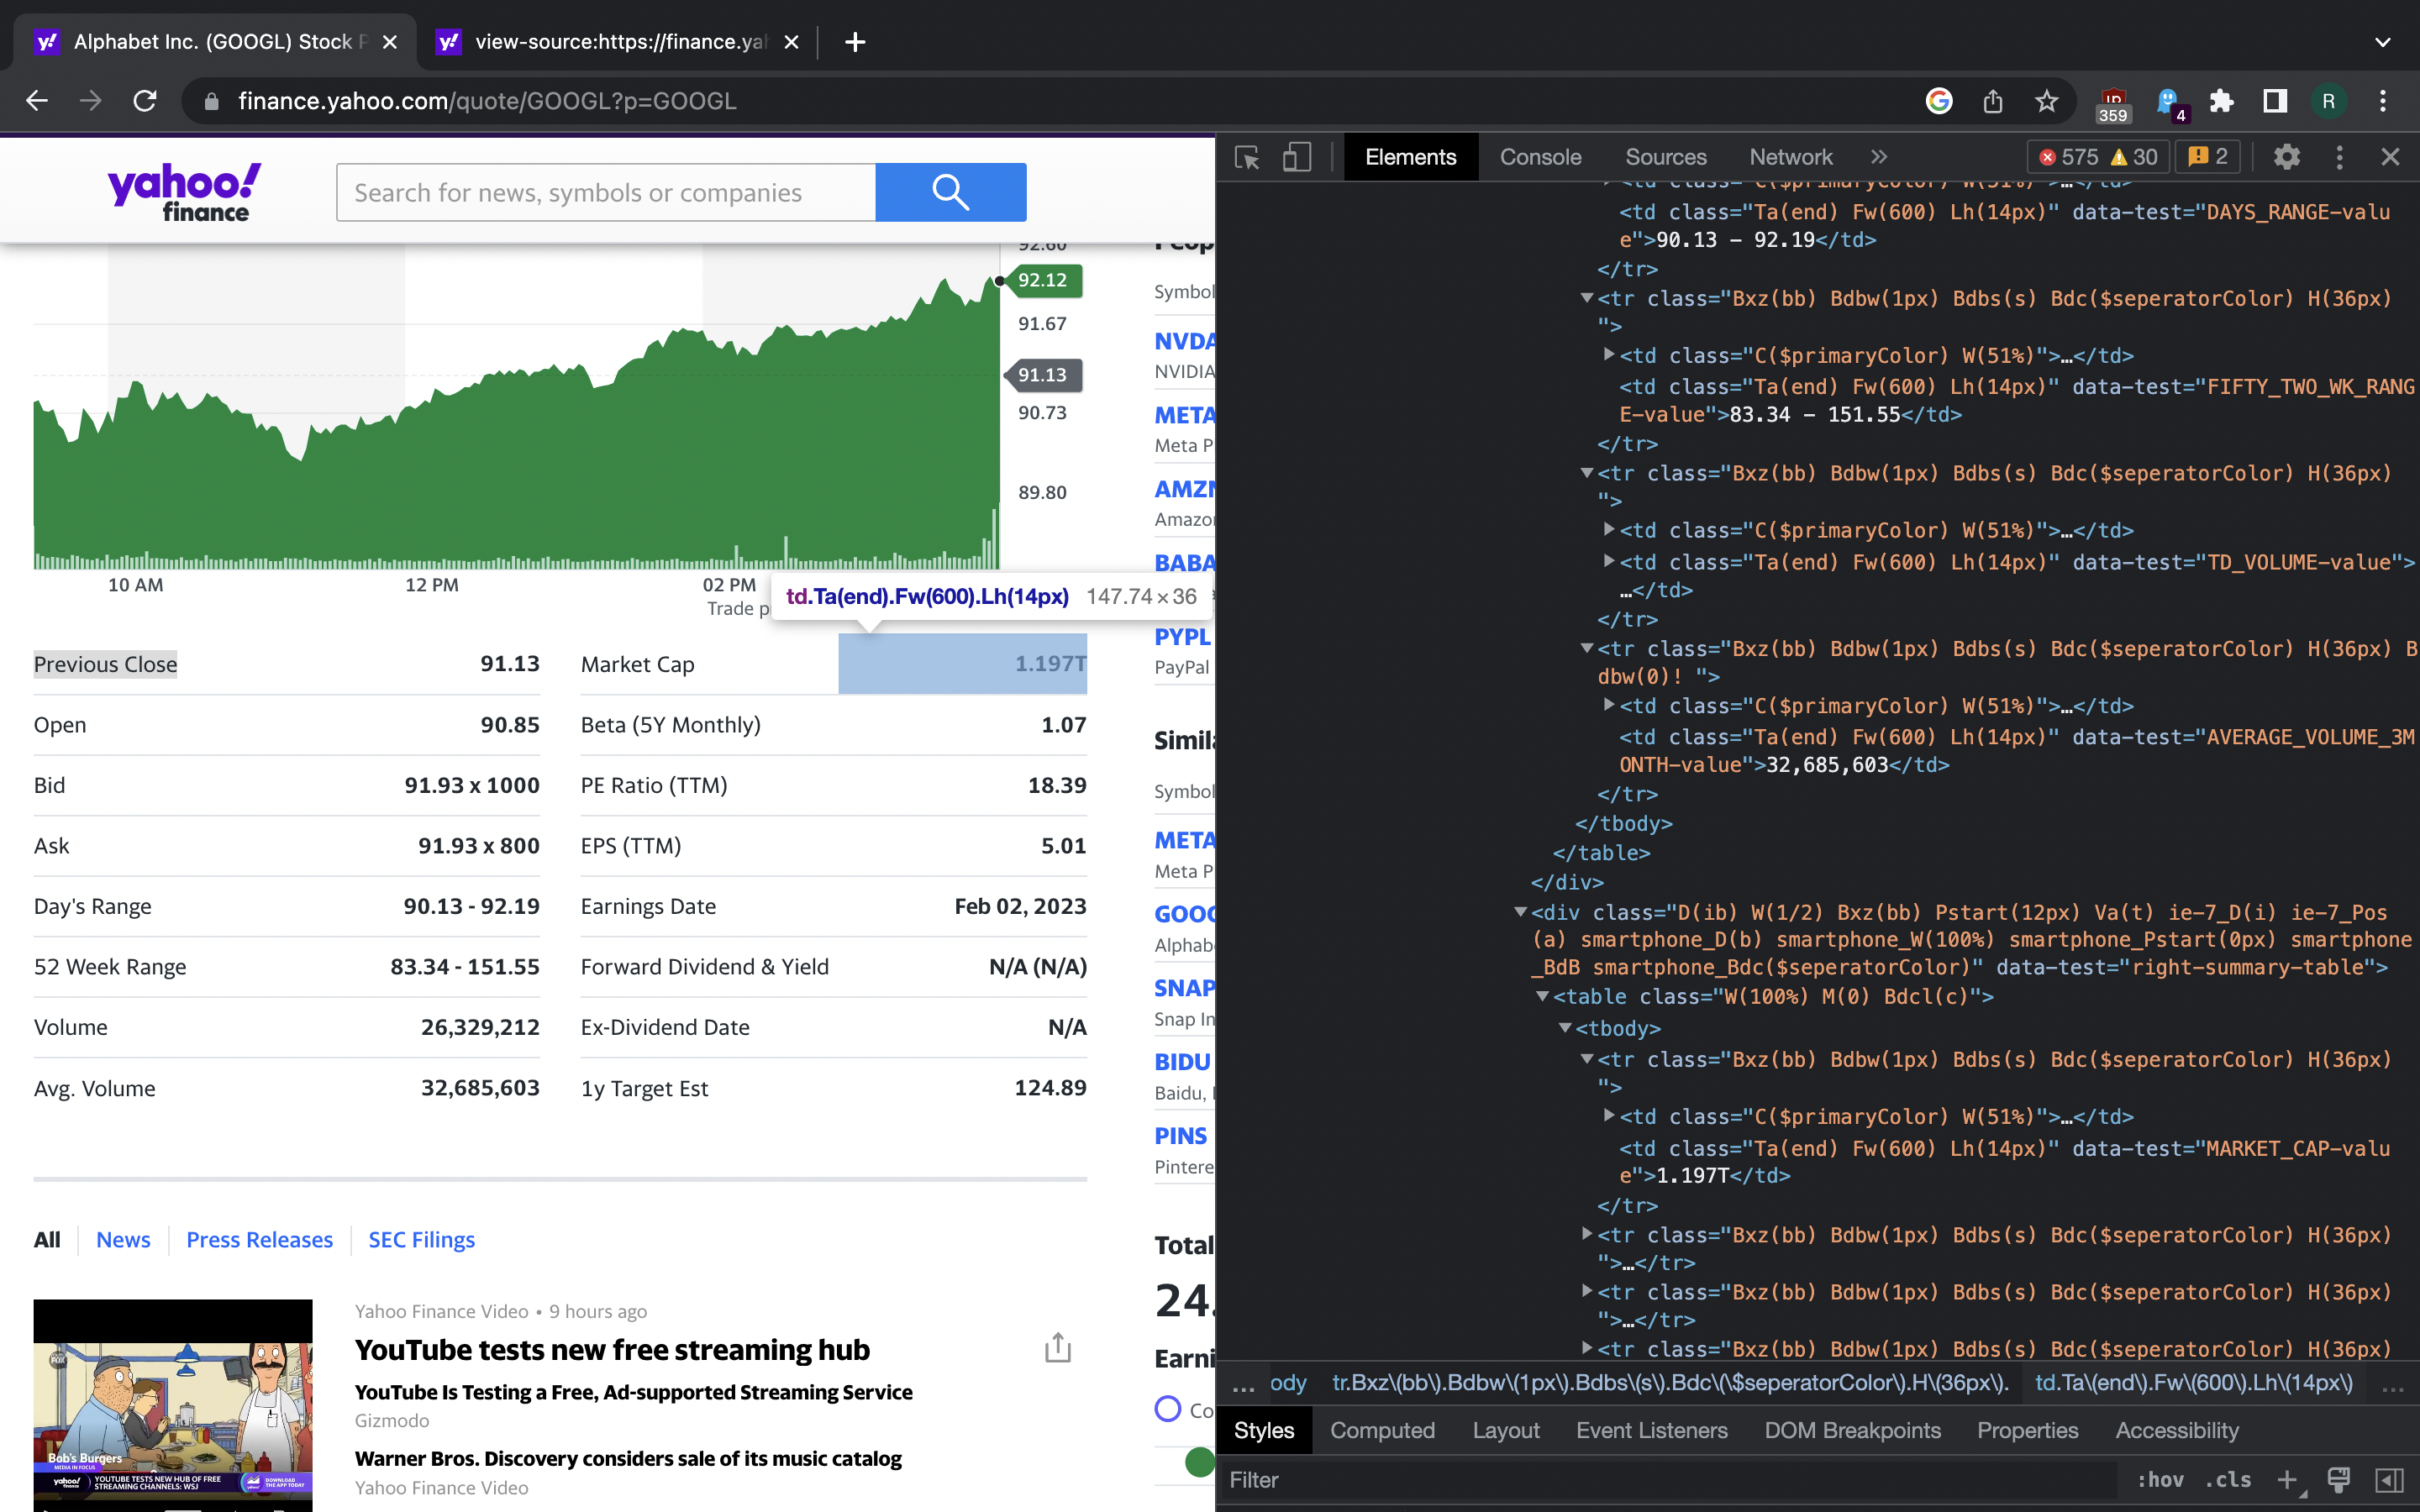
Could it be that other value fields also have data-test attribute that we
can use for finding them in a DOM? Indeed they do: it’s MARKET_CAP-value
for market cap, BID-value for bid, ASK-value for asking price and so on.
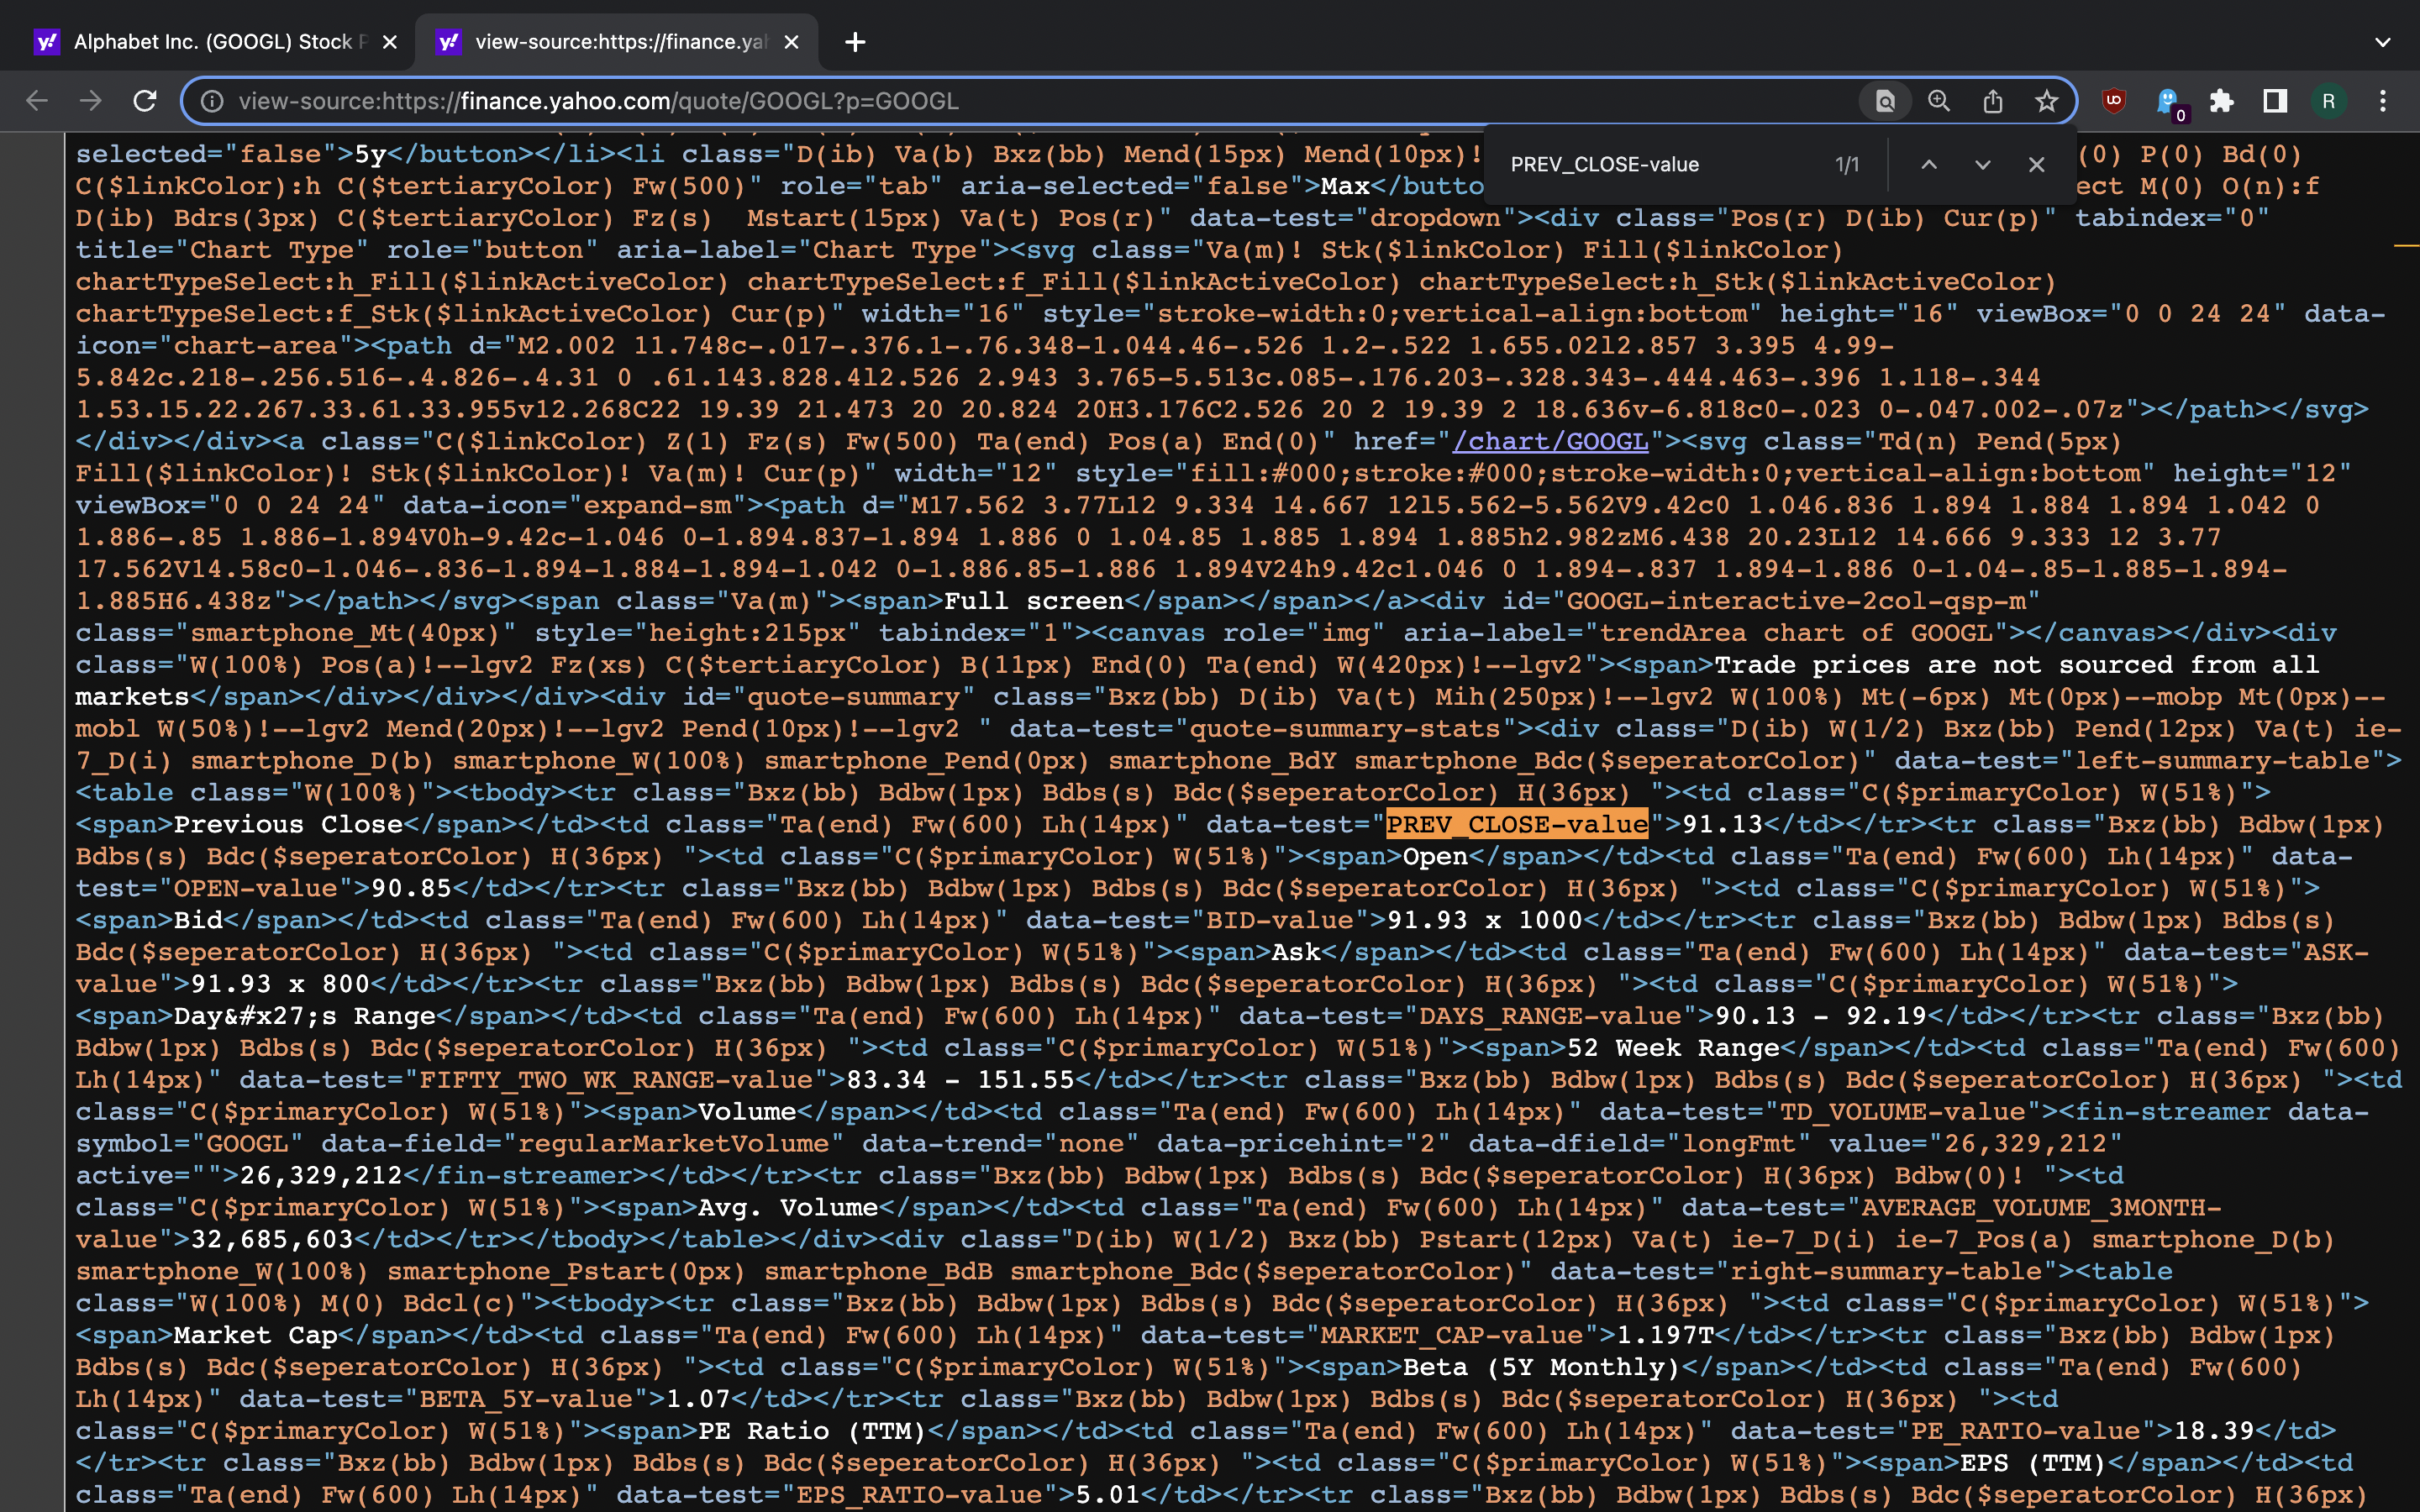
However, there’s one last thing we should check. The DOM we see now in DevTools
Elements tab is the one that may or may not be a result of client-side
rendering. Since we are going to use plain requests for scraping, we want to
see if the the same data-test attribute values appear in the HTML document
that browser downloads before the rendering. We can verify that by using
View Source feature.
Given what we have found, writing XPath queries for the fields is quite trivial:
$ python3
Python 3.10.8 (main, Oct 13 2022, 09:48:40) [Clang 14.0.0 (clang-1400.0.29.102)] on darwin
Type "help", "copyright", "credits" or "license" for more information.
>>> import requests
>>> from lxml import html
>>> resp = requests.get("https://finance.yahoo.com/quote/GOOGL")
>>> resp
<Response [200]>
>>> tree = html.fromstring(resp.text)
>>> tree.xpath('//td[@data-test="EARNINGS_DATE-value"]/span/text()')
['Feb 02, 2023']
>>> tree.xpath('//td[@data-test="PREV_CLOSE-value"]/text()')
['91.13']
Getting a page URL given the stock symbol is easy: just append it to
https://finance.yahoo.com/quote/.
The entire Python script that reads tickers from a text file and scrapes the summary table for each of them would be like this:
#!/usr/bin/python3

import csv
from pprint import pprint

import requests
from lxml import html

FIELDNAMES = [
    "ticker",
    "prev_close",
    "open",
    "bid",
    "ask",
    "days_range",
    "52_wk_range",
    "volume",
    "avg_volume",
    "market_cap",
    "beta",
    "pe",
    "eps",
    "earnings_date",
    "fw_dividend_and_yield",
    "ex_dividend_date",
    "1y_target_est",
    "url",
]


def scrape_summary(ticker):
    url = "https://finance.yahoo.com/quote/" + ticker

    xpath_by_field = {
        "prev_close": '//td[@data-test="PREV_CLOSE-value"]/text()',
        "open": '//td[@data-test="OPEN-value"]/text()',
        "bid": '//td[@data-test="BID-value"]/text()',
        "ask": '//td[@data-test="ASK-value"]/text()',
        "days_range": '//td[@data-test="DAYS_RANGE-value"]/text()',
        "52_wk_range": '//td[@data-test="FIFTY_TWO_WK_RANGE-value"]/text()',
        "volume": '//td[@data-test="TD_VOLUME-value"]/fin-streamer/text()',
        "avg_volume": '//td[@data-test="AVERAGE_VOLUME_3MONTH-value"]/text()',
        "market_cap": '//td[@data-test="MARKET_CAP-value"]/text()',
        "beta": '//td[@data-test="BETA_5Y-value"]/text()',
        "pe": '//td[@data-test="PE_RATIO-value"]/text()',
        "eps": '//td[@data-test="EPS_RATIO-value"]/text()',
        "earnings_date": '//td[@data-test="EARNINGS_DATE-value"]/span/text()',
        "fw_dividend_and_yield": '//td[@data-test="DIVIDEND_AND_YIELD-value"]/text()',
        "ex_dividend_date": '//td[@data-test="EX_DIVIDEND_DATE-value"]//text()',
        "1y_target_est": '//td[@data-test="ONE_YEAR_TARGET_PRICE-value"]/text()',
    }

    row = {"ticker": ticker, "url": url}

    resp = requests.get(url)
    print(resp.url)

    tree = html.fromstring(resp.text)

    for f in xpath_by_field.keys():
        try:
            row[f] = tree.xpath(xpath_by_field[f])[0]
        except Exception as e:
            print(f)
            print(e)

    return row


def main():
    in_f = open("tickers.txt", "r")
    tickers = in_f.read().strip().split("\n")
    in_f.close()

    out_f = open("summary.csv", "w", encoding="utf-8")
    csv_writer = csv.DictWriter(out_f, fieldnames=FIELDNAMES, lineterminator="\n")
    csv_writer.writeheader()

    for ticker in tickers:
        row = scrape_summary(ticker)
        if row is not None:
            pprint(row)
            csv_writer.writerow(row)

    out_f.close()


if __name__ == "__main__":
    main()
When launching this, we get some stock summaries saved into summary.csv file.
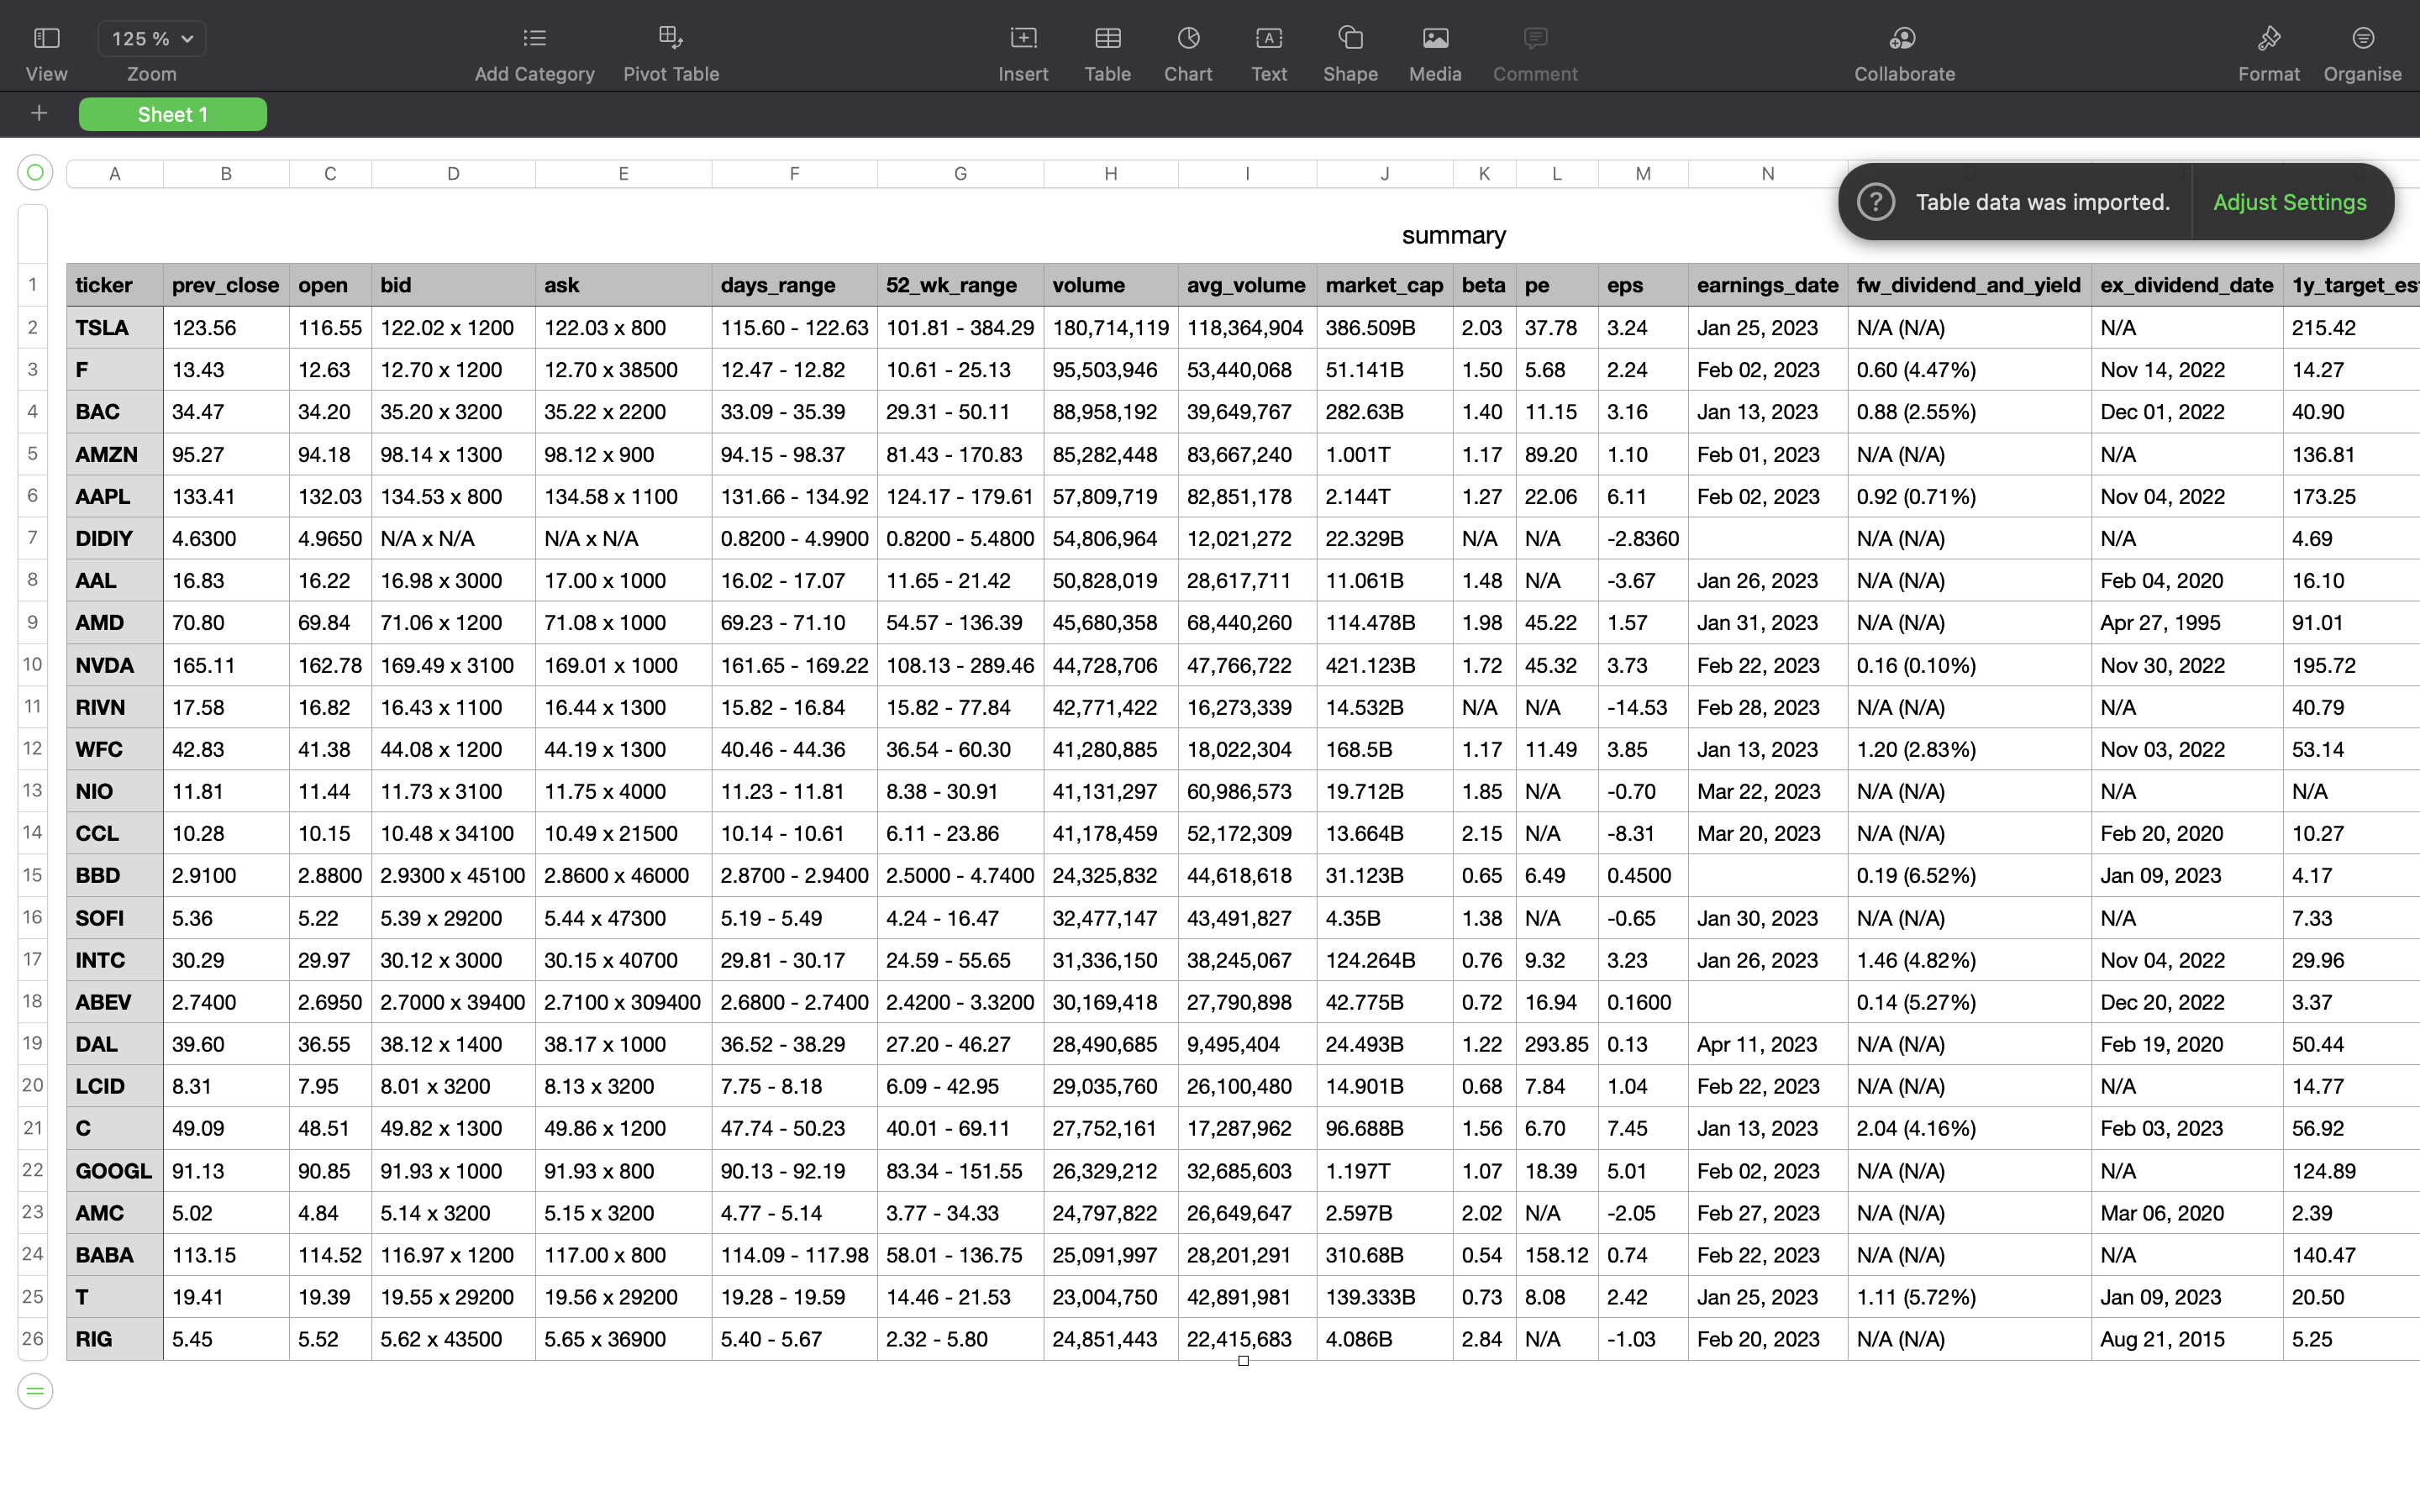
Now let us explore how that little stock price chart is getting data. Switch on the DevTools and go to Network tab. Press XHR button so that it shows only the requests that are launched by client-side JS code. Then press some of the time range switches on top of the chart and see what happens.
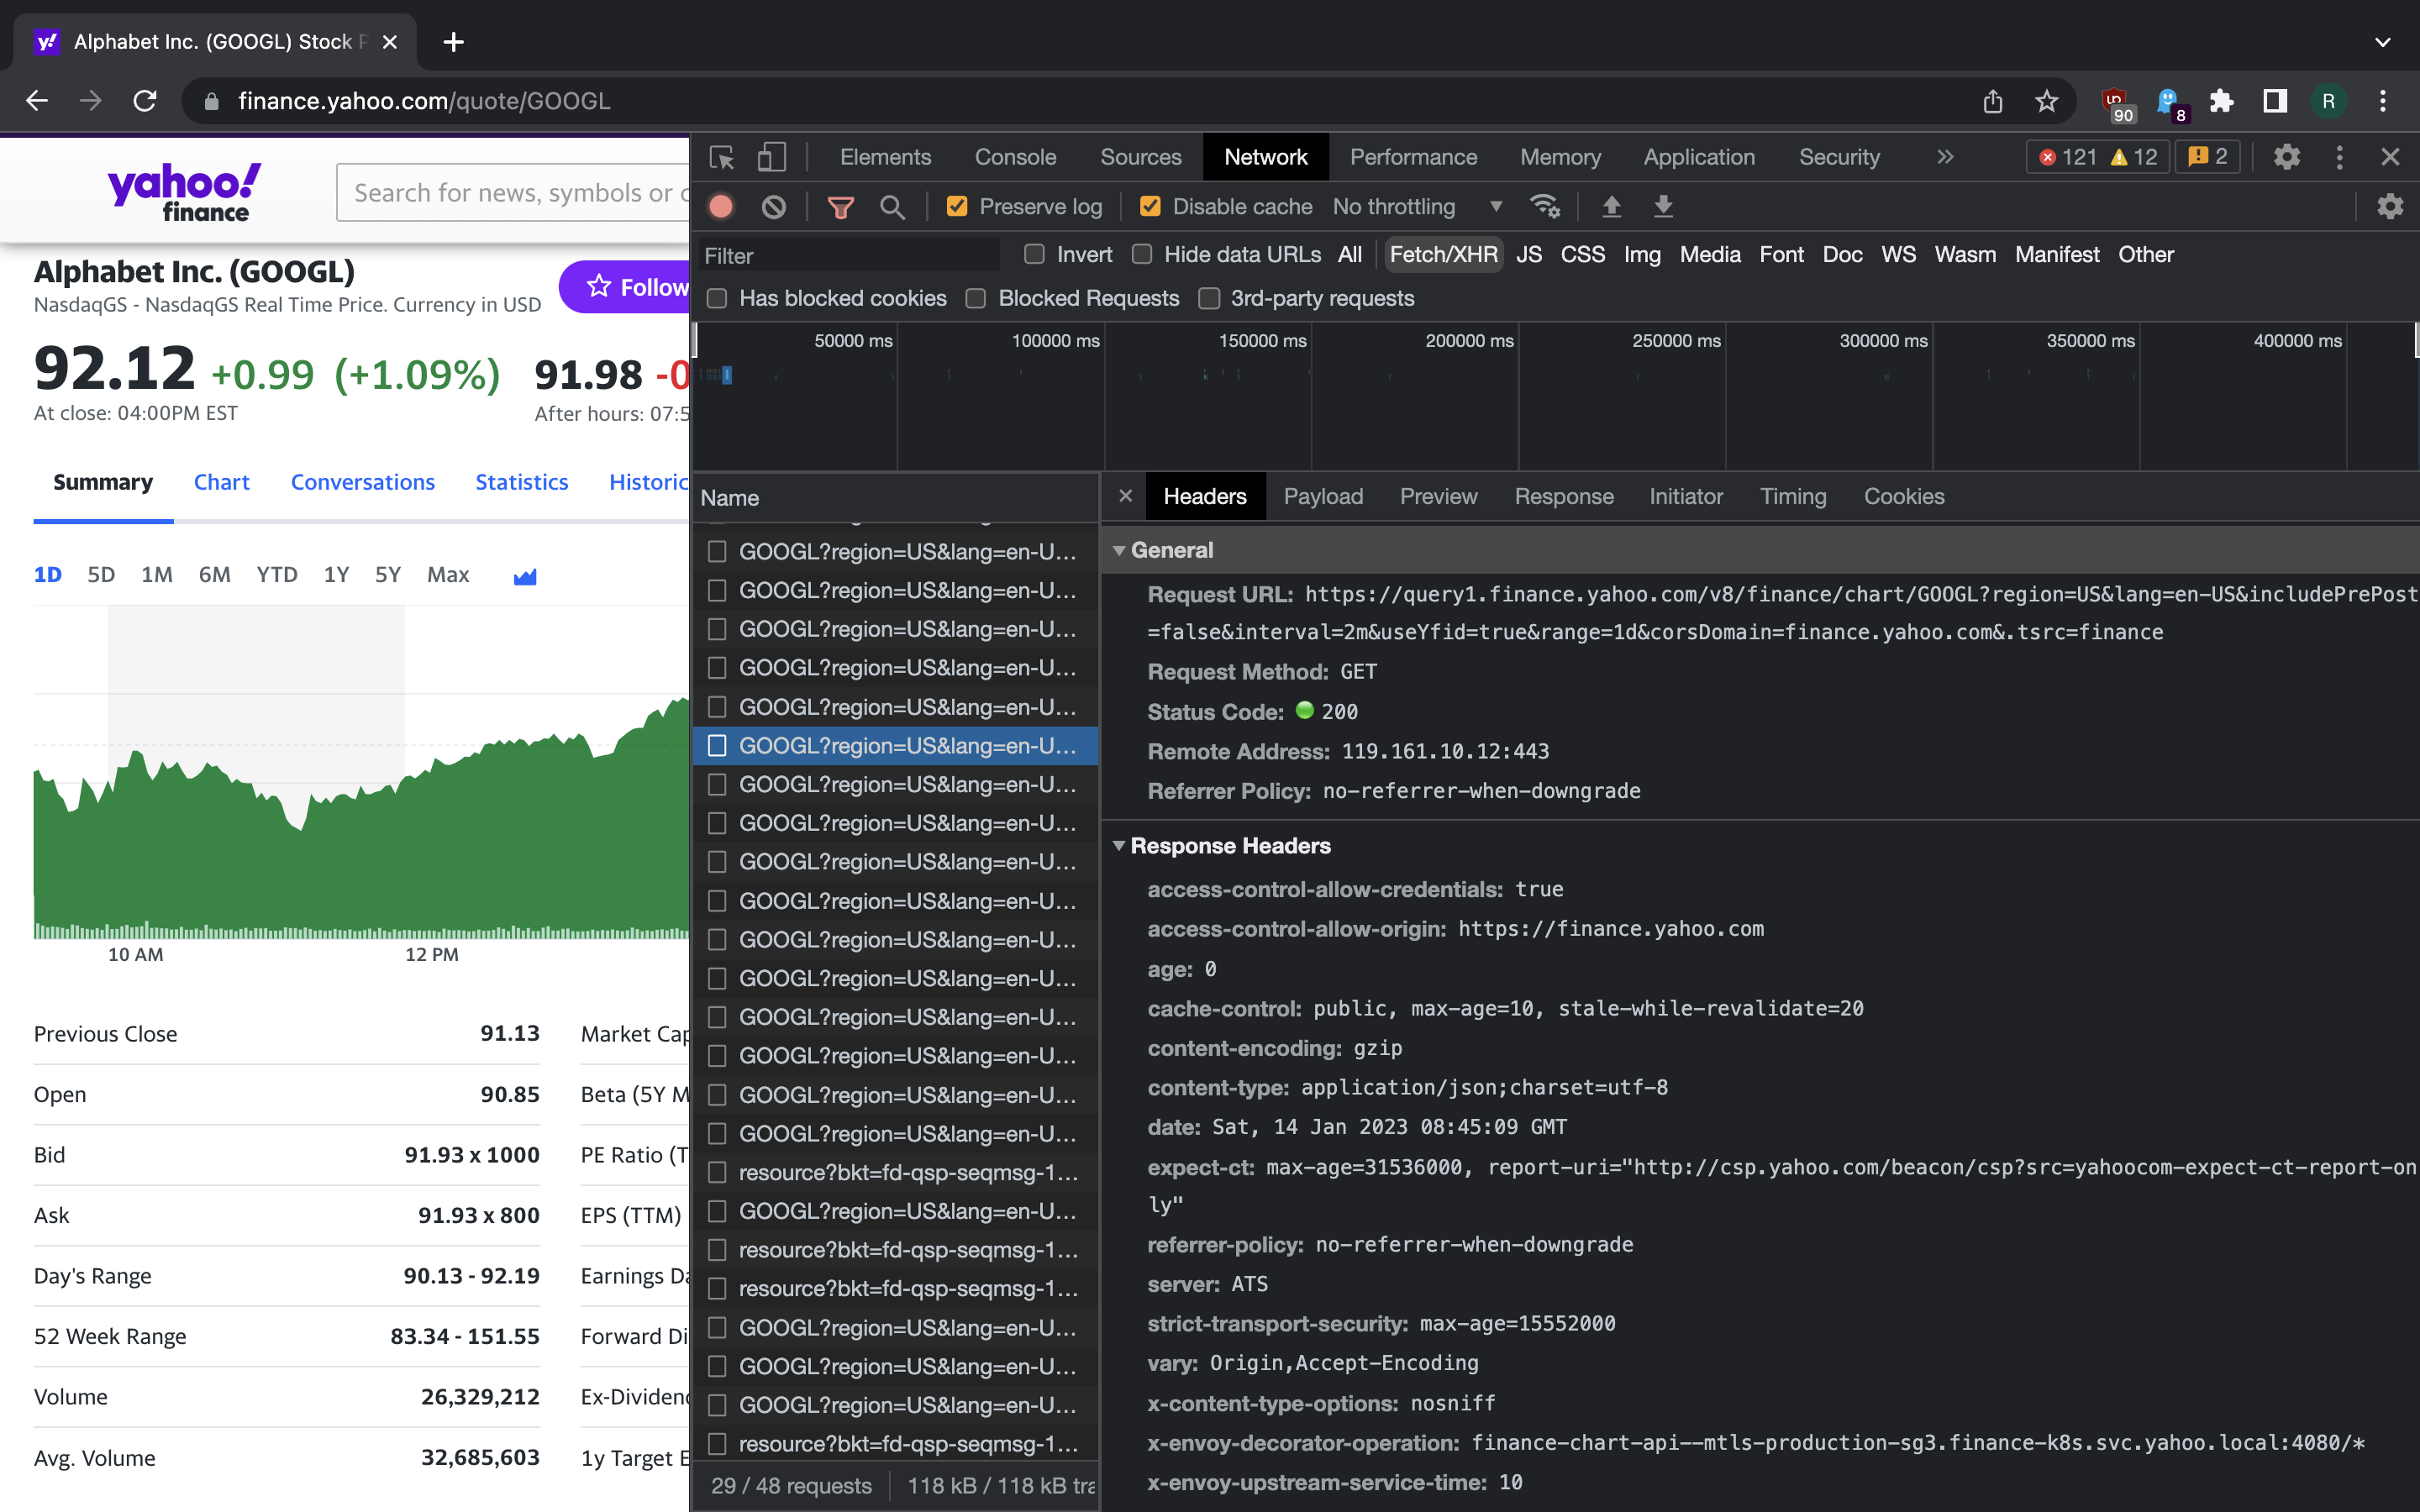
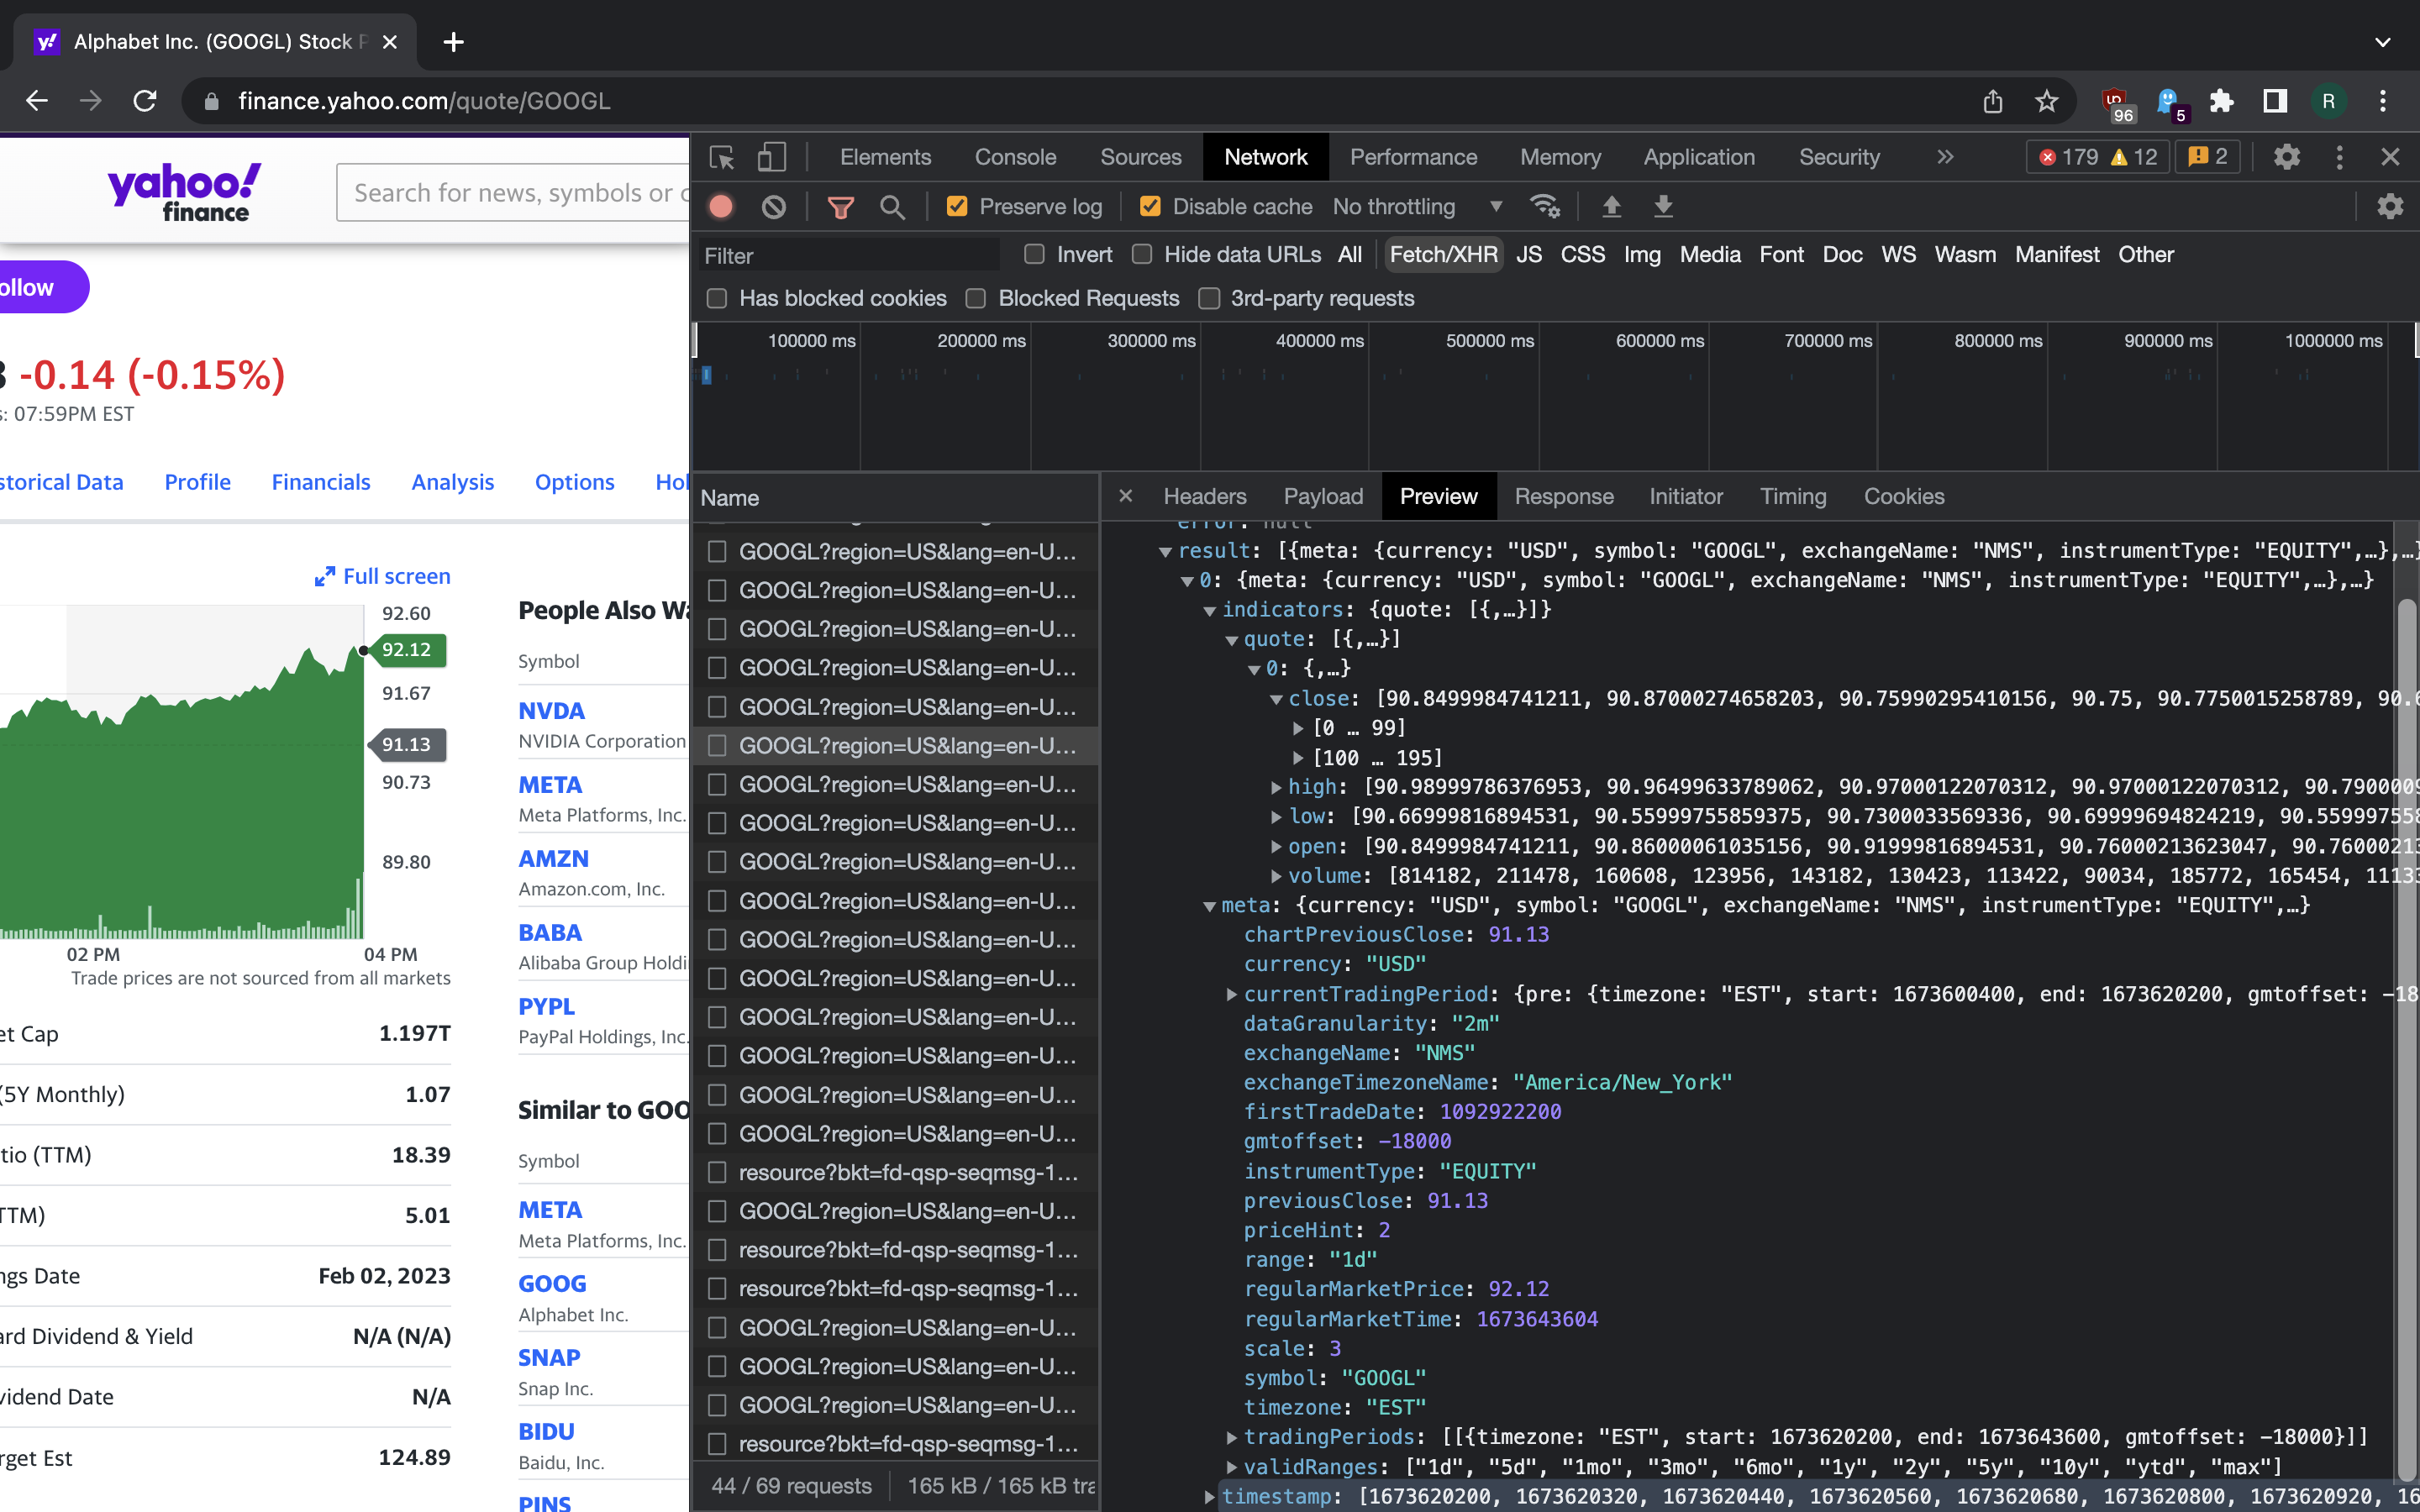
We see that there’s an API call that fetches the the price data during time window that the user chose. A list of valid ranges is included into API response as well.
We would like to scrape all the data that is needed to recreate a candle chart. Each candlestick in the chart represents the following price number for a day, hour, minute or some other interval:
- Open Price - price of asset at the beginning of interval.
- Close Price - price at the end of interval.
- Low Price - lowest price during the interval.
- High Price - highest price during the interval.
For more information, see this article.
This is indeed what the private Yahoo! Finance API gives us. Note that we get many intervals across the big range that was selected on the chart. Both candle interval and overall range can be chosen by setting the appropriate parameters.
Since this is fairly straightforward API scraping, our code is simple as well:
#!/usr/bin/python3

import csv
import sys

import requests

FIELDNAMES = ["symbol", "timestamp", "open", "close", "high", "low", "url"]


def main():
    if len(sys.argv) != 4:
        print("Usage:")
        print("{} <symbol> <interval> <range>".format(sys.argv[0]))
        return 0

    symbol = sys.argv[1]
    interval = sys.argv[2]
    range_ = sys.argv[3]

    if not range_ in [
        "1d",
        "5d",
        "1mo",
        "3mo",
        "6mo",
        "1y",
        "2y",
        "5y",
        "10y",
        "ytd",
        "max",
    ]:
        print("Error: Invalid range")
        return -1

    params = {
        "region": "US",
        "lang": "en-US",
        "includePrePost": False,
        "interval": interval,
        "useYfid": True,
        "range": range_,
        "corsDomain": "finance.yahoo.com",
        ".tsrc": "finance",
    }

    url = "https://query1.finance.yahoo.com/v8/finance/chart/" + symbol

    resp = requests.get(
        url,
        params=params,
        headers={
            "User-Agent": "Mozilla/5.0 (Macintosh; Intel Mac OS X 10_15_7) AppleWebKit/537.36 (KHTML, like Gecko) Chrome/109.0.0.0 Safari/537.36"
        },
    )
    print(resp.url)

    result_dict = resp.json().get("chart", dict()).get("result")[0]
    timestamps = result_dict.get("timestamp")
    quote_dict = result_dict.get("indicators").get("quote")[0]
    open_prices = quote_dict.get("open")
    close_prices = quote_dict.get("close")
    high_prices = quote_dict.get("high")
    low_prices = quote_dict.get("low")

    out_f = open(symbol + ".csv", "w", encoding="utf-8")

    csv_writer = csv.DictWriter(out_f, fieldnames=FIELDNAMES, lineterminator="\n")
    csv_writer.writeheader()

    for i in range(len(timestamps)):
        row = {
            "symbol": symbol,
            "timestamp": timestamps[i],
            "open": open_prices[i],
            "close": close_prices[i],
            "high": high_prices[i],
            "low": low_prices[i],
            "url": resp.url,
        }

        csv_writer.writerow(row)

    out_f.close()


if __name__ == "__main__":
    main()
We went through a couple of simple Yahoo! Finance scraping examples, but there’s far more data that could be scraped from there. One could scrape financial news articles to do market sentiment analysis on them, further quantitive data from Statistic, Historical Data, Financials and other tabs of stock page. For some markets, real time data is available via web socket.
Furthermore, it is possible to do pure API scraping by tapping into Yahoo! Finance mobile app API communications and reproducing them programmatically. This would let us avoid doing any HTML parsing with XPath queries, like we avoided in our time series example.